Multiple Choice
(Figure: Interpreting Price Changes) Based on the graph, if the price for shoes increases from $40 to $80 (from point d to point b) , the net revenue lost, or gained, would be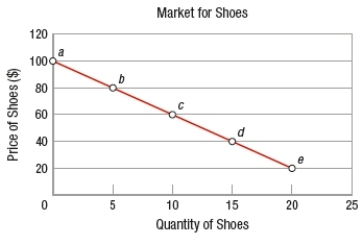
A) $0 net loss/gain.
B) $200 net gain.
C) $200 net loss.
D) $400 net gain.
Correct Answer:

Verified
Correct Answer:
Verified
Related Questions
Q140: Suppose that the quantity demanded of a
Q141: Which of these is NOT a determinant
Q142: For which good would consumers be the
Q143: Two goods whose cross elasticity of demand
Q144: An elastic supply curve that is linear
Q146: The more time consumers have to adjust
Q147: If the demand for a good is
Q148: (Figure: Effects of Excise Tax) Based on
Q149: Products with many close substitutes tend to
Q150: The market period supply curve is perfectly