Multiple Choice
(Figure) The figure shows two supply curves for two different periods for the same product. If the price of the product increased from $20 to $25, the price elasticity of supply will be _____ in the short run and _____ in the long run using the midpoint method.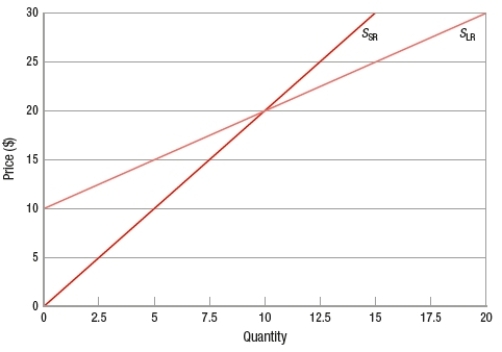
A) 1; 1.8
B) 0.56; 1
C) 1.8; 1.5
D) 1; 1.67
Correct Answer:

Verified
Correct Answer:
Verified
Q63: When a product's price changes from $26
Q64: Measuring elasticities in percentage terms allows us
Q65: The demand for a particular brand of
Q66: Average income in the town of Growthville
Q67: (Figure: Effects of Excise Tax) Based on
Q69: If sales of apples decrease by 5%
Q70: Which statement does NOT explain the inelastic
Q71: Assume that Vitamin Water and Gatorade are
Q72: When income elasticity of demand is equal
Q73: Demand for McDonald's hamburgers is more elastic