Multiple Choice
(Figure: Determining Consumer and Producer Surplus) Based on the graph, producer surplus is shown by area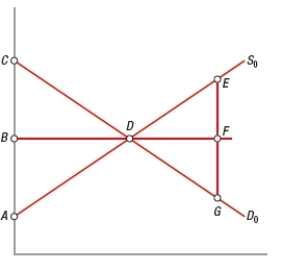
A) ABD.
B) ACD.
C) DEF.
D) BCD.
Correct Answer:

Verified
Correct Answer:
Verified
Related Questions
Q342: Which factor would increase elasticity of demand
Q343: If the price of JoBob's Beef Jerky
Q344: Loss leaders primarily rely on which of
Q345: A restaurant's offer of free children's meals
Q346: If a 1% increase in the price
Q348: If demand is unitary elastic, then the<br>A)
Q349: If research finds demand elasticities of 0.05
Q350: A tax on a product<br>A) has no
Q351: A supply curve in the long run
Q352: Suppose the market for premium music streaming