Multiple Choice
(Figure) The graph depicts a market with a supply tax. Using the equilibrium prices and quantities before and after the tax, the price elasticity of demand is _____. Use the midpoint method to calculate your answers.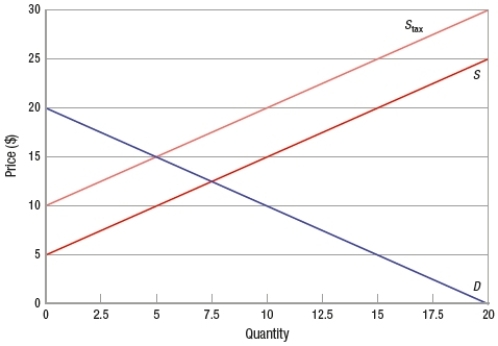
A) 0.45
B) 1.8
C) 2.2
D) 1.01
Correct Answer:

Verified
Correct Answer:
Verified
Related Questions
Q130: Price elasticity of demand is a measure
Q131: Home heating gas tends to have _
Q132: If the price elasticity of demand for
Q133: If a good has an elasticity of
Q134: When the price of a good decreases
Q136: Suppose your income falls from $35,000 to
Q137: Which of these could be a possible
Q138: Suppose that Nisshodo's Mochi shop raises the
Q139: In general, the longer the period producers
Q140: Suppose that the quantity demanded of a