Multiple Choice
Region 1 of the growth curve of bacteria shown in the illustration below depicts the ________ of growth.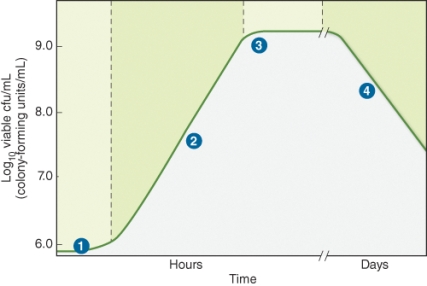
A) log phase
B) stationary phase
C) lag phase
D) death phase
Correct Answer:

Verified
Correct Answer:
Verified
Related Questions
Q11: When we look at the ion and
Q12: PCR is a highly accurate and relatively
Q13: The point marked "y" on the plot
Q14: The viable cell count (cells/ml) from the
Q15: How does the exponential growth of bacterial
Q17: The viable cell count (cells/ml) from the
Q18: In a hypotonic environment, which way will
Q19: Although classified as a micronutrient, the iron
Q20: The illustration below depicts the growth of
Q21: Which of the following cell types cannot