Multiple Choice
Region 3 of the growth curve of bacteria shown in the illustration below depicts the ________ of growth.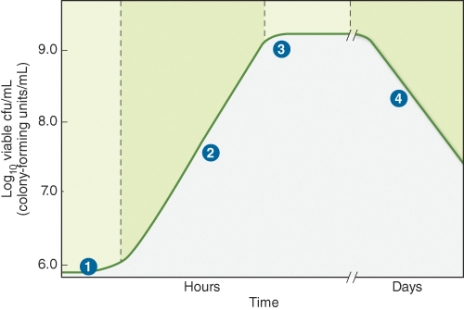
A) log phase
B) stationary phase
C) lag phase
D) death phase
Correct Answer:

Verified
Correct Answer:
Verified
Related Questions
Q68: A psychrophilehas an optimum growth rate _.<br>A)
Q69: Which of the following methods of measuring
Q70: Which of the following statements are true
Q71: In a hypertonic environment, which way will
Q72: Which of the following chemicals may be
Q74: Which of these is a correct match?
Q75: Optimum growth rate is above 80ᵒC for
Q76: How can growth medium be classified? (Select
Q77: The major characteristics of chemical control agents
Q78: The illustration below depicts the growth of