Multiple Choice
The concentration of a compound, X, is measured at different time intervals during the course of a chemical reaction. After plotting a graph of the concentration of X against time, shown in the graph below, the points labelled A-E on the graph have the following co-ordinates: A: x = 0 seconds; y = 0 mol L-1
B: x = 8 seconds; y = 0.37 mol L-1
C: x = 15 seconds; y = 0.49 mol L-1
D: x = 23 seconds; y = 0.63 mol L-1
E: x = 30 seconds; y = 0.62 mol L-1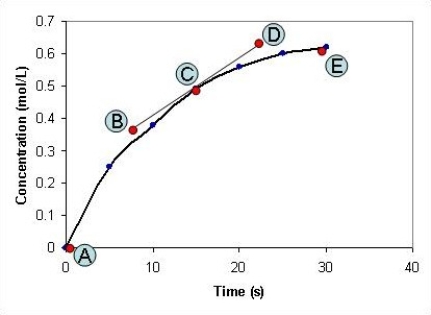 What is the rate of the chemical reaction after the reaction has been proceeding for fifteen seconds?
A) 3.26 mol L-1 s-1
B) 0.017 mol L-1 s-1
C) 0.021 mol L-1 s-1
D) 57.7 mol L-1 s-1
E) 48.39 mol L-1 s-1
Correct Answer:

Verified
Correct Answer:
Verified
Q4: Which of the following statements concerning the
Q5: Which one of the following statements is
Q6: Match the type of enzyme inhibition with
Q7: When the temperature of a reaction is
Q8: The way in which the rate of
Q10: Which of the following correctly describes the
Q11: The activation energy of a reaction is
Q12: The following graph depicts the rate of
Q13: Look at the graph below. At which
Q14: An enzyme-catalyzed reaction can be represented by