Multiple Choice
Refer to the graph.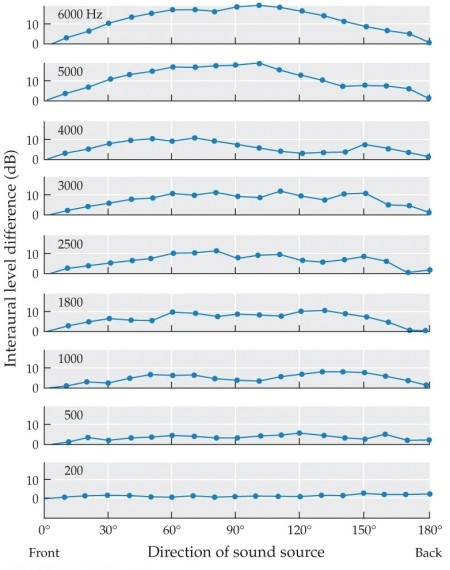 This graph shows _______ for tones of different frequencies presented at different positions around the head.
A) interaural level differences
B) cones of confusion
C) pitch differences
D) loudness differences
E) interaural time differences
Correct Answer:

Verified
Correct Answer:
Verified
Related Questions
Q19: Suppose you are in the woods and
Q20: If someone's lateral superior olive structures are
Q21: What is auditory stream segregation and what
Q22: Neurons that are sensitive to intensity differences
Q23: Which method(s) of sound localization between the
Q25: _ is the lowest-frequency component of a
Q26: The _ is a relay station in
Q27: _ is the perceptual organization of a
Q28: Which of the following do(es) not contribute
Q29: A very simple example of auditory stream