Multiple Choice
The figure below shows Sue's and Carlos' demand curves for gasoline. It would be useful to find the equation of the demand curves to answer the questions below.
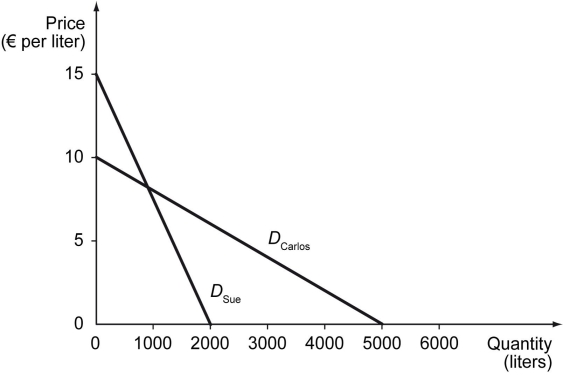
-Refer to the figure above.If the price of gasoline is 12.00 euros per liter,the total quantity of gasoline demanded is ________ liters.
A) 0
B) 400
C) 1,000
D) 1,600
Correct Answer:

Verified
Correct Answer:
Verified
Q46: The following figure shows the demand curves
Q47: The numbers in the table below characterize
Q48: Scenario: Suppose Major League Baseball (MLB) is
Q49: Which of the following is likely to
Q50: Should an economist consider a Web-based job
Q52: Which of the following does NOT have
Q53: Which of the following best describes the
Q54: The following table shows the market demand
Q55: Other things remaining same,a leftward shift in
Q56: The following table shows the supply schedule