Multiple Choice
The following figure shows the demand and supply curves for USB flash drives at different price levels. D is the demand curve, and S₁ is the initial supply curve.
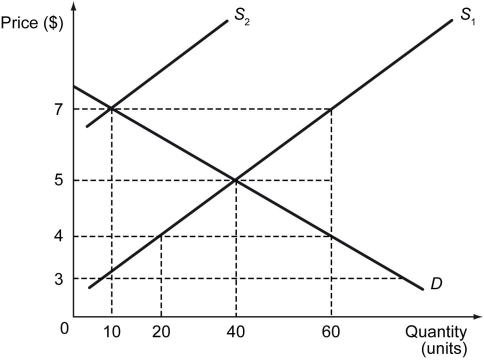
-Refer to the figure above.When the demand curve for flash drives is D and the supply curve of flash drives is S₁,the equilibrium price is ________.
A) $3
B) $4
C) $5
D) $7
Correct Answer:

Verified
Correct Answer:
Verified
Q40: Which of the following is a feature
Q41: The figure below shows Sue's and Carlos'
Q42: How does the study reported in the
Q43: Using graphs,explain how the equilibrium price and
Q44: Scenario: A market researcher asks three consumers,
Q46: The following figure shows the demand curves
Q47: The numbers in the table below characterize
Q48: Scenario: Suppose Major League Baseball (MLB) is
Q49: Which of the following is likely to
Q50: Should an economist consider a Web-based job