Multiple Choice
The following figure shows the demand and supply curves for gas. D₁ is the initial demand curve, and S is the supply curve.
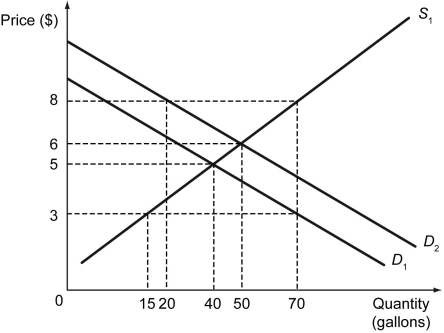
-Refer to the figure above.When the demand curve for gas is D₂ and the supply curve for gas is S,the surplus in the market when price is $8 is ________ gallons.
A) 20
B) 25
C) 50
D) 55
Correct Answer:

Verified
Correct Answer:
Verified
Q22: Scenario: Suppose Major League Baseball (MLB) is
Q23: The following table shows the market demand
Q24: The following table shows the demand schedules
Q25: In a market for apples,a consumer purchases
Q26: Which of the following examples best describes
Q28: Assume that the supply curve for a
Q29: The acai berry and products made from
Q30: The concept of diminishing marginal benefit states
Q31: The following figure shows the demand and
Q32: The figure below shows Sue's and Carlos'