Multiple Choice
The country described in the table below produces and consumes only three goods: energy drinks, pizza, and t-shirts. The quantity produced and price of each good in 2016 and 2017 are provided.
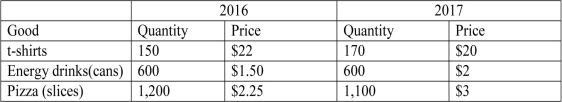
-Refer to the above table.Assuming that 2016 is the base year,by what percentage did prices change between 2016 and 2017?
A) Prices rose by 11 percent.
B) Prices rose by 15 percent.
C) Prices fell by 5 percent.
D) Prices fell by 9 percent.
Correct Answer:

Verified
Correct Answer:
Verified
Q195: An apparel manufacturer bought raw materials worth
Q196: An macroeconomics class is likely to discuss
Q197: Why are the values of inputs not
Q198: The following table contains prices and quantities
Q199: Which of the following will be included
Q201: When was the only time in the
Q202: The difference between _ is known as
Q203: _ is the market value of production
Q204: What does a circular flow diagram show?
Q205: Scenario: Mike's housekeeper charges $30 for mowing