Multiple Choice
The following table shows economic data for two countries.
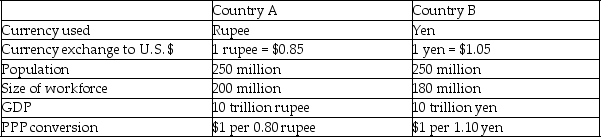
-Refer to the table above.The GDP per capita in Country A adjusted for purchasing power parity (PPP) is equal to ________.
A) $27,200
B) $34,000
C) $50,000
D) $53,125
Correct Answer:

Verified
Correct Answer:
Verified
Related Questions
Q87: Which of the following is an example
Q88: The following figure shows the total output
Q89: An aggregate production function shows _.<br>A) various
Q90: Scenario: The price of a standard basket
Q91: The _ in output due to each
Q93: The GDP of Neonland is 450,000 neons.It
Q94: Which of the following is likely to
Q95: If the aggregate income of an island
Q96: Berylia's aggregate production function is Y =
Q97: The following figure shows two aggregate production