Multiple Choice
The following figure shows two aggregate production functions.
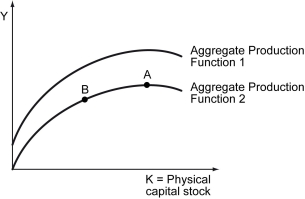
-Refer to the figure above.Assume the economy is at point B of the aggregate production function 2 in 2010.It will move toward point A in 2012 if the ________.
A) quantity of physical capital increases and technology remains constant
B) quantity of physical capital increases and technology increases
C) number of workers increases and technology remains constant
D) total efficiency units of labor increase and technology increases
Correct Answer:

Verified
Correct Answer:
Verified
Q179: Which of the following is true?<br>A) The
Q180: Scenario: Two economies, A and B, have
Q181: The average income per capita in a
Q182: Scenario: Country X and Country Y have
Q183: In France and Spain,a Big Mac costs
Q185: What are the features of a Cobb-Douglas
Q186: If _,the total efficiency units of labor
Q187: Scenario: Farm Country and Industry Country are
Q188: Suppose the average productivity of workers in
Q189: Scenario: Red Country and Purple Country have