Multiple Choice
The following figure shows two aggregate production functions.
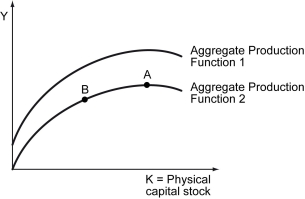
-Refer to the figure above.What does the slope of the aggregate production function 2 between the origin and point A imply?
A) The returns for increases in the physical capital stock are decreasing.
B) The returns for increases in the physical capital stock are increasing.
C) The returns for increases in the physical capital stock are negative.
D) The returns for increases in the physical capital stock are first positive and then negative.
Correct Answer:

Verified
Correct Answer:
Verified
Q142: Which of the following is likely to
Q143: The total efficiency units of labor is
Q144: Scenario: Farm Country and Industry Country are
Q145: An international agency uses the prices of
Q146: Scenario: Two neighboring countries, Sweetland and Sourland,
Q148: Scenario: Two neighboring countries, Sweetland and Sourland,
Q149: Suppose production in an economy is represented
Q150: Scenario: The price of a standard basket
Q151: In Lutheria,there are 10,000 people in the
Q152: Scenario: Assume the following aggregate production functions