Multiple Choice
The following table shows the GDP per capita of country X for 3 years.
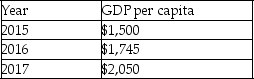
-Refer to the table above.At what rate did the country grow between 2016 and 2017?
A) 13.63 percent
B) 15.55 percent
C) 17.47 percent
D) 19.24 percent
Correct Answer:

Verified
Correct Answer:
Verified
Related Questions
Q35: Which of the following identifies the correct
Q36: Consider a closed economy without a government.If
Q37: The following table shows the GDP per
Q38: Which of the following statements is true?<br>A)
Q39: Which of the following statements is true?<br>A)
Q41: Which of the following statements is true
Q42: The following table shows levels of consumption
Q43: The saving rate indicates _.<br>A) the fraction
Q44: Approximately how long ago did the Industrial
Q45: If d is the depreciation rate and