Multiple Choice
The following figure shows graphs of various types of growth.
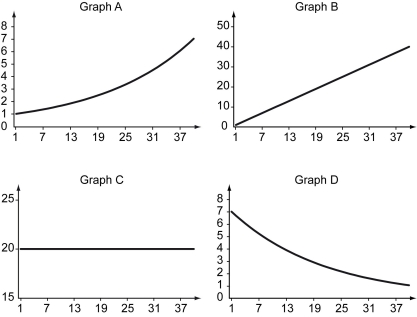
-Refer to the figure above.The data in Graph C best represent ________.
A) linear growth
B) no growth
C) exponential growth
D) exponential decline
Correct Answer:

Verified
Correct Answer:
Verified
Related Questions
Q2: Scenario: Consider two countries: Country A and
Q3: Scenario: Consider two countries, Country A and
Q4: Consider two countries,Country A and Country B,that
Q5: Scenario: In the fictional nation of Gallifrey,
Q6: The following figure shows the production function
Q8: What is the Industrial Revolution? How did
Q9: If GDP per capita in year T
Q10: Country A's GDP per capita at the
Q11: The following table shows levels of consumption
Q12: Define saving rate.If the aggregate saving in