Multiple Choice
The figure below shows labor supply and labor demand curves.
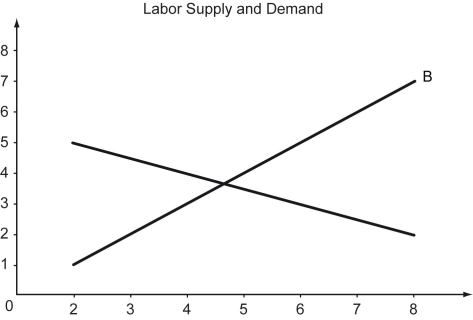
-Refer to the figure above.What is the appropriate label for curve B?
A) Labor demand curve
B) Quantity of labor
C) Labor supply curve
D) Wage rate
Correct Answer:

Verified
Correct Answer:
Verified
Related Questions
Q92: The following table compares labor statistics for
Q93: Scenario: The unemployment rate in Country Y
Q94: Which of the following statements is true
Q95: What will happen to the demand curve
Q96: Which of the following statements is true
Q98: Minimum wages _.<br>A) benefit all workers in
Q99: Scenario: The unemployment rate in Country Y
Q100: A worker is said to be unemployed
Q101: The labor demand curve is _.<br>A) horizontal<br>B)
Q102: Which of the following statements is true?<br>A)