Multiple Choice
The following figure shows two labor demand curves, LD₁ and LD₂, and two labor supply curves, LS₁ and LS₂.
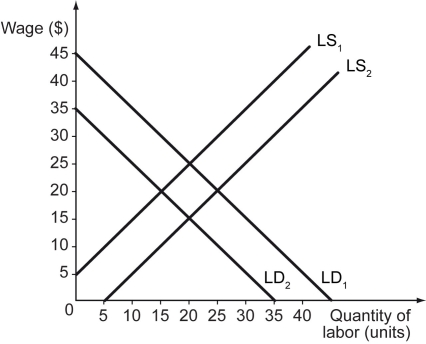
-Refer to the figure above.What is the equilibrium wage rate if the labor demand curve is LD₁ and the labor supply curve is LS₁?
A) $15
B) $20
C) $25
D) $30
Correct Answer:

Verified
Correct Answer:
Verified
Q1: How do efficiency wages help increase a
Q3: The figure below shows labor supply and
Q4: Which of the following statements is true
Q5: Scenario: 100 people live in Country X,
Q6: If,at a given wage,the quantity of labor
Q7: Scenario: Truck drivers across the country are
Q8: The following figure shows the labor demand
Q9: For the textile industries of England in
Q10: Which of the following groups of people
Q11: Collective bargaining between unions and employers often