Multiple Choice
The following figure shows the labor demand curve, LD₁, and labor supply curve, LS₁, in a market.
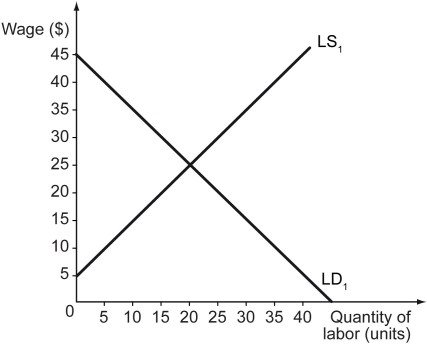
-Refer to the figure above.Calculate the equilibrium wage rate and the equilibrium level of employment.
A) $15 and 35 units of labor
B) $20 and 15 units of labor
C) $25 and 20 units of labor
D) $35 and 10 units of labor
Correct Answer:

Verified
Correct Answer:
Verified
Q55: Any change that affects the entire schedule
Q56: The following figure shows the labor demand
Q57: Which of the following is likely to
Q58: What causes the labor demand curve to
Q59: Scenario: Suppose an economy consists of only
Q61: Scenario: Truck drivers across the country are
Q62: Which of the following statements is true?<br>A)
Q63: As a firm hires more and more
Q64: The impact of an increase in the
Q65: Everything else remaining unchanged,what is likely to