Multiple Choice
The following figure shows the labor demand curve, LD₁, and labor supply curve, LS₁, in a market.
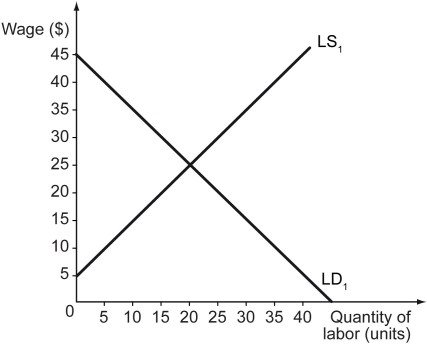
-Refer to the figure above.If the government fixes the minimum wage rate at $25,the unemployment in the market will be ________.
A) 0 units of labor
B) 10 units of labor
C) 20 units of labor
D) 30 units of labor
Correct Answer:

Verified
Correct Answer:
Verified
Q78: Suppose the labor market for industrial workers
Q79: Scenario: Truck drivers across the country are
Q80: If the quantity of labor demanded exceeds
Q81: Scenario: The labor market equilibrium for ski
Q82: Scenario: 100 people live in Country X,
Q84: The value of the marginal product of
Q85: Which categories of people are excluded when
Q86: If the opportunity cost of working outside
Q87: Which of the following statements is true?<br>A)
Q88: The following figure shows wage versus labor