Multiple Choice
The following figure shows wage rate versus quantity of labor.
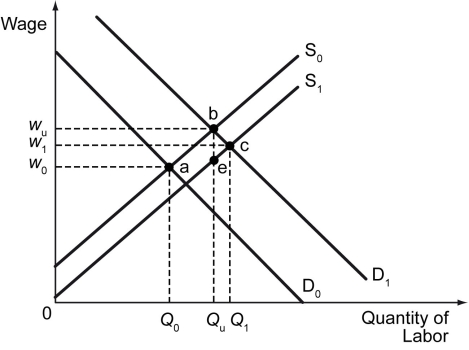
-Refer to the figure above.If S₁ is the labor supply curve and D₁ is the labor demand curve at a balance between recession and boom,what point represents the quantity of labor and wage rate?
A) Point a
B) Point b
C) Point c
D) Point e
Correct Answer:

Verified
Correct Answer:
Verified
Q98: Minimum wages _.<br>A) benefit all workers in
Q99: Scenario: The unemployment rate in Country Y
Q100: A worker is said to be unemployed
Q101: The labor demand curve is _.<br>A) horizontal<br>B)
Q102: Which of the following statements is true?<br>A)
Q104: Scenario: The labor market equilibrium for ski
Q105: Which of the following groups of people
Q106: Scenario: The labor market equilibrium for ski
Q107: If the number of potential workers in
Q108: Which of the following equations is correct?<br>A)