Multiple Choice
The following table shows some labor statistics for four years.
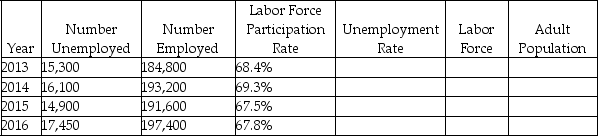
-Refer to the table above.Based on unemployment rates,which year appears to be a cyclical downturn?
A) 2013
B) 2014
C) 2015
D) 2016
Correct Answer:

Verified
Correct Answer:
Verified
Related Questions
Q25: The figure below shows labor supply and
Q26: Which of the following is true of
Q27: At a fixed level of worker productivity,_.<br>A)
Q28: The slope of the labor demand curve
Q29: The figure below shows labor supply and
Q31: Downward wage rigidity arises when _.<br>A) workers
Q32: Which of the following statements is true?<br>A)
Q33: The following table compares labor statistics for
Q34: Scenario: The labor market equilibrium for ski
Q35: If the opportunity cost of working outside