Multiple Choice
The following figure shows two credit demand curves, CD₁ and CD₂, and two credit supply curves, CS₁ and CS₂.
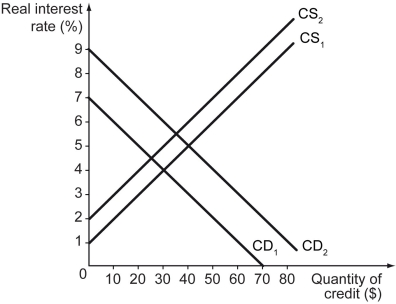
-Refer to the figure above.What is the equilibrium quantity of credit when the credit demand curve is CD₁ and the credit supply curve is CS₁?
A) $20
B) $30
C) $40
D) $50
Correct Answer:

Verified
Correct Answer:
Verified
Q117: In the United States,bank reserves include _.<br>A)
Q118: Which of the following will NOT be
Q119: Which of the scenarios below describes a
Q120: Everything else remaining unchanged,what is likely to
Q121: Which of the following equations is correct?<br>A)
Q123: What is meant by the term "rate
Q124: Consider two banks: Bank A and Bank
Q125: Credit is _.<br>A) the loan that a
Q126: The following table shows the assets and
Q127: The following table lists some statistics on