Multiple Choice
The following figure plots real interest rate against quantity of credit.
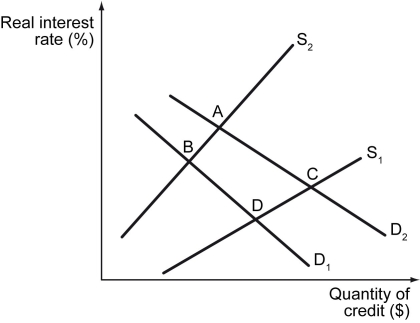
-Refer to the figure above.Assume that the loanable funds market initially is in equilibrium at point D.Why might the equilibrium move to point C?
A) Increase of the interest rate
B) Increased business confidence
C) Decreased business confidence
D) Decrease of the value of the U.S. dollar
Correct Answer:

Verified
Correct Answer:
Verified
Q103: The credit supply curve is _.<br>A) vertical<br>B)
Q104: One of the impacts of maturity transformation
Q105: If the annual inflation rate in an
Q106: Which of the following statements is true
Q107: The Bank of Lithasia plans to increase
Q109: Savers are willing to lend out money
Q110: Assuming all else equal,any change that causes
Q111: If the stockholders' equity of a bank
Q112: The value of the real estate that
Q113: Which of the following equations is correct?<br>A)