Multiple Choice
The figure below shows the labor demand and labor supply curves for an economy.
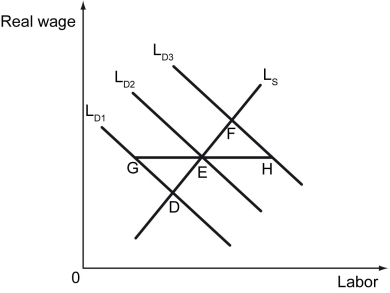
-Refer to the figure above.The economy is currently at E.Which of the following is likely to happen if a recession hits the economy,assuming that there is downward rigidity of wages?
A) The labor market equilibrium will move from point E to point G.
B) The labor market equilibrium will move from point E to point H.
C) The labor market equilibrium will move from point E to point D.
D) The labor market equilibrium will move from point E to point F.
Correct Answer:

Verified
Correct Answer:
Verified
Q43: How do animal spirits affect GDP?
Q44: During an expansion,real GDP rises.Which of the
Q45: Declines in housing prices in the United
Q46: On a graph with real GDP growth
Q47: If the aggregate price level _,but nominal
Q49: If a recession hits Potentia,its government can
Q50: The demand for Country Y's most important
Q51: Fears of an impending civil war in
Q52: Which of the following describes how much
Q53: An initial leftward shift in labor demand