Multiple Choice
The following figure shows the demand and supply curve for dollars against the rupee.
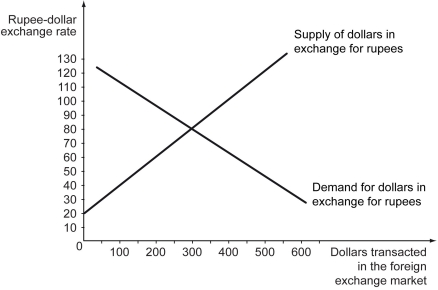
-Refer to the figure above.The equilibrium quantity of dollars traded is ________.
A) $50
B) $100
C) $300
D) $650
Correct Answer:

Verified
Correct Answer:
Verified
Related Questions
Q14: Which of the following is most likely
Q15: The following figure shows the equilibrium in
Q16: Consider an economy that is greatly dependent
Q17: Everything else being equal,a depreciation of the
Q18: Domestic interest rates influence the real exchange
Q20: Which of the following equations correctly represents
Q21: Assume that at the beginning of 2012,1
Q22: The nominal exchange rate is a price.
Q23: The following figure shows the equilibrium in
Q24: If the dollar price of a good