Multiple Choice
The following figure shows the net exports curve for a country:
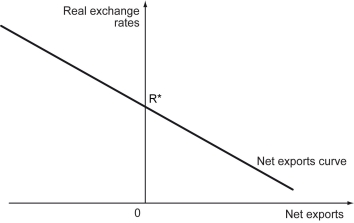
-Refer to the figure above.When the real exchange rate is below R*,________.
A) net exports are negative
B) net exports are positive
C) net exports are zero
D) net exports can be positive or negative depending on the value of R*
Correct Answer:

Verified
Correct Answer:
Verified
Q86: An undervalued domestic currency _.<br>A) benefits all
Q87: Assume that the dollar price of a
Q88: Everything else being equal,an appreciation of the
Q89: Which of the following statements is true?<br>A)
Q90: If an overvalued currency is allowed to
Q92: What will be the likely impact of
Q93: If the Fed lowers the interest rate
Q94: An overvalued domestic currency _.<br>A) benefits all
Q95: If a country wants to keep its
Q96: Are black markets for foreign currencies more