True/False
The following figure shows the net exports curve for a country:
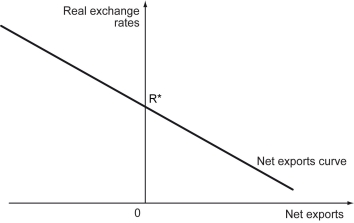
-Refer to the figure above.When the real exchange rate is below R*,there is a trade surplus.
Correct Answer:

Verified
Correct Answer:
Verified
Related Questions
Q3: Differentiate between the process of defending an
Q4: What is the foreign exchange market?
Q5: If the government of a country adopts
Q6: If the government of a country does
Q7: When Walmart sells toys imported from China,_.<br>A)
Q9: Why is the eurozone called a currency
Q10: When a currency is undervalued relative to
Q11: Are exchange rates and unemployment rates related?
Q12: The following figure shows the net exports
Q13: Judging from the declining foreign exchange reserves,the