Multiple Choice
Figure 8-2
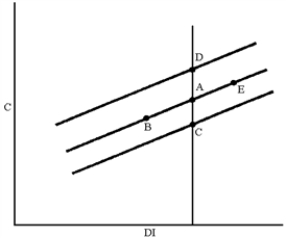
-In Figure 8-2, which of the following moves can be explained by an increase in government transfer payments?
A) A to B
B) A to C
C) A to D
D) A to E
Correct Answer:

Verified
Correct Answer:
Verified
Related Questions
Q186: According to economists, how does an increase
Q187: In the national income accounts, the symbol
Q188: The MPC can be used to predict
Q189: The most volatile component of aggregate demand
Q190: An economic boom in one country usually
Q192: U.S.imports are most likely to increase when<br>A)U.S.GDP
Q193: The circular flow diagram is best described
Q194: Consumer spending is an injection in the
Q195: Which of the following is an example
Q196: The system of measurement for expressing macroeconomic