Multiple Choice
Figure 10-4
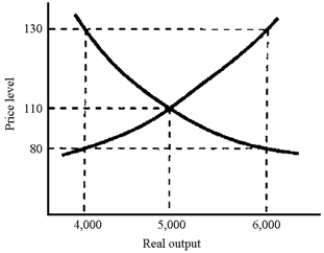
-In Figure 10-4, if full employment occurs at 5,000 and the price level is currently 130, then we can expect the
A) aggregate supply curve to shift to the left until a new equilibrium is established at an output level of 4,000.
B) aggregate demand curve to shift to the right until a new equilibrium is established at an output level of 6,000.
C) the price level to fall to 110.
D) aggregate demand to shift to the left and aggregate supply to shift to the right until the price level reaches 130.
Correct Answer:

Verified
Correct Answer:
Verified
Q17: The aggregate supply curve will shift to
Q28: Wage decreases lead to a decrease in
Q29: In response to the demands of environmentalists,
Q30: Figure 10-7<br> <img src="https://d2lvgg3v3hfg70.cloudfront.net/TB2282/.jpg" alt="Figure 10-7
Q31: When the inflationary gap is finally eliminated,
Q34: Aggregate supply is defined as<br>A)how much the
Q38: Stabilization policy may be necessary to modify
Q98: The usual results of an adverse supply
Q105: If the price level does not fall
Q166: Stagflation may follow an inflationary boom.