Multiple Choice
Figure 10-5 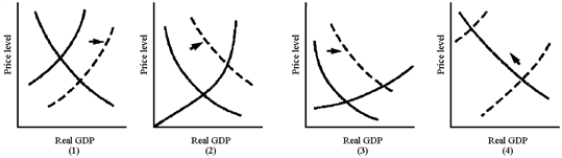
-In Figure 10-5, which graph best illustrates the situation of an economy reacting to a recessionary gap by reducing resource cost levels?
A) (1)
B) (2)
C) (3)
D) (4)
Correct Answer:

Verified
Correct Answer:
Verified
Related Questions
Q68: Stagflation is the typical result of adverse
Q69: The combination of high unemployment and high
Q70: When the expenditure schedule is too low,
Q71: What is meant by an economy's self-correcting
Q72: Why is a period of stagflation part
Q74: Figure 10-3<br> <img src="https://d2lvgg3v3hfg70.cloudfront.net/TB8592/.jpg" alt="Figure 10-3
Q75: The existence of an inflationary gap should
Q76: The reason that stagflation tends to follow
Q77: An increase in the nominal wage shifts
Q78: A period of stagflation can be considered