Multiple Choice
Figure 11-3
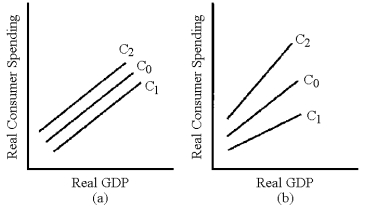
-In Figure 11-3,which line represents the change in the consumption schedule caused by a cut in fixed taxes?
A) C1 in graph (a)
B) C2 in graph (a)
C) C1 in graph (b)
D) C2 in graph (b)
Correct Answer:

Verified
Correct Answer:
Verified
Q9: Table 11-1 <img src="https://d2lvgg3v3hfg70.cloudfront.net/TB8592/.jpg" alt="Table 11-1
Q59: How does a tax cut affect the
Q79: In an effort to balance the budget,
Q95: As a general rule, when an income
Q101: Most of the taxes collected by governments
Q104: Figure 11-2<br> <img src="https://d2lvgg3v3hfg70.cloudfront.net/TB8592/.jpg" alt="Figure 11-2
Q166: If personal income tax rates are decreased
Q196: One of the practical issues in the
Q203: Conservatives usually favor increasing government spending to
Q204: How does an increase in taxes affect