Multiple Choice
Figure 11-3
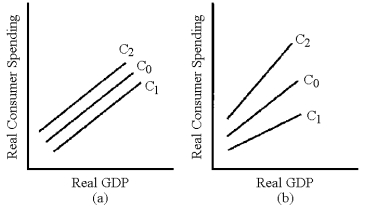
-In Figure 11-3,which line represents the change in the consumption schedule caused by a cut in the personal income tax as advocated by President George W.Bush in 2001?
A) C1 in graph (a)
B) C2 in graph (a)
C) C1 in graph (b)
D) C2 in graph (b)
Correct Answer:

Verified
Correct Answer:
Verified
Q2: During the deliberations on fiscal stimulus in
Q22: Why is the personal income tax considered
Q25: Supply-side tax cuts tend to benefit the
Q38: If the demand-side effects of supply-side tax
Q74: An increase in Social Security payments to
Q91: Do policy makers know the exact value
Q144: Which of the following will shift the
Q144: During the 2008 presidential campaign, candidate Barack
Q148: At any given price level, equilibrium GDP
Q160: Supply-side tax cuts are more likely to