Multiple Choice
Figure 20-5
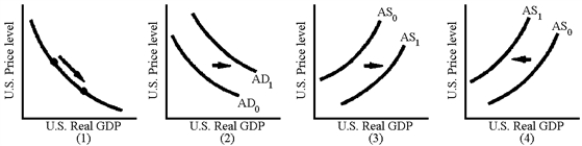
-Which of the graphs in Figure 20-5 are consistent with an appreciation of the U.S.dollar caused by an increase in U.S.interest rates?
A) 1
B) 2
C) 3
D) 4
Correct Answer:

Verified
Correct Answer:
Verified
Q7: Suppose that the Fed decides to increase
Q21: In an open economy, the government deficit
Q22: One of the principal factors behind the
Q36: When the U.S.dollar appreciates,<br>A)U.S.exports rise.<br>B)U.S.imports decline.<br>C)aggregate demand
Q51: A depreciating currency makes foreign inputs cheaper
Q53: <br> <img src="https://d2lvgg3v3hfg70.cloudfront.net/TB2282/.jpg" alt="
Q55: The expected effects of fiscal contraction are<br>A)higher
Q56: Appreciation of the dollar will make imported
Q59: The expected effects of an increased budget
Q117: The sequence of events following an increase