Multiple Choice
Figure 20-8
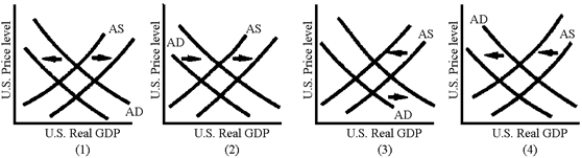
-Which of the graphs in Figure 20-8 represents the effects of a currency appreciation?
A) 1
B) 2
C) 3
D) 4
Correct Answer:

Verified
Correct Answer:
Verified
Related Questions
Q31: A rise in net exports shifts the
Q109: What important lesson did American economists learn
Q118: In an open economy, aggregate supply consists
Q140: Explain how exchange rate changes affect aggregate
Q151: Depreciation of the Japanese Yen would lead
Q153: An exchange rate depreciation acts to reduce
Q154: An increase in the U.S.price level relative
Q156: A depreciation of the U.S.dollar has the
Q157: A recession abroad would cause U.S.net exports
Q160: <br> <img src="https://d2lvgg3v3hfg70.cloudfront.net/TB2282/.jpg" alt="