Multiple Choice
Figure 20-8
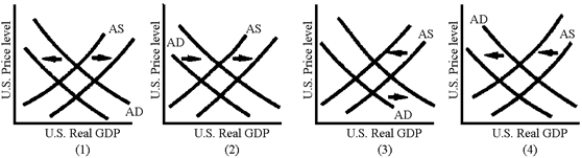
-Which of the graphs in Figure 20-8 illustrates the AD-AS shifts associated with an expansionary monetary policy?
A) 1
B) 2
C) 3
D) 4
Correct Answer:

Verified
Correct Answer:
Verified
Related Questions
Q10: When the dollar depreciates, the prices of
Q43: Explain how exchange rates affect the level
Q78: A reduction in net exports shifts the
Q115: Do you agree that currency depreciation will
Q123: A decrease in the price level in
Q146: Theoretically, when a currency depreciates one can
Q187: Table 20-1<br>Suppose the economy of Macroland is
Q191: <br> <img src="https://d2lvgg3v3hfg70.cloudfront.net/TB2282/.jpg" alt="
Q196: Interest rate increases lead to currency appreciation
Q197: If the international value of the dollar