Multiple Choice
Figure 20-8
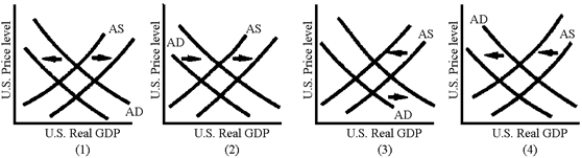
-Which of the graphs in Figure 20-8 illustrates the AD-AS shifts associated with a currency depreciation?
A) 1
B) 2
C) 3
D) 4
Correct Answer:

Verified
Correct Answer:
Verified
Related Questions
Q22: <br> <img src="https://d2lvgg3v3hfg70.cloudfront.net/TB2282/.jpg" alt="
Q23: In an open economy net exports must
Q24: Increases in stock market wealth have caused
Q26: An expansionary fiscal policy makes the exchange
Q27: Figure 20-6<br> <img src="https://d2lvgg3v3hfg70.cloudfront.net/TB2282/.jpg" alt="Figure 20-6
Q29: International capital flows tend to reduce the
Q70: The principal reason why Thailand, Indonesia, and
Q87: If (X − IM) < 0, then
Q191: How do the fluctuations in the exchange
Q214: An appreciation of the Japanese yen relative