Multiple Choice
Figure 1:
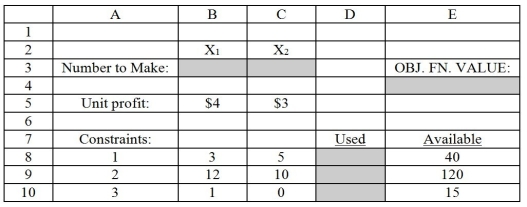
Figure 1 demonstrates an Excel spreadsheet that is used to model the following linear programming problem:
Note: Cells B3 and C3 are the designated cells for the optimal values of X₁ and X₂,respectively,while cell E4 is the designated cell for the objective function value.Cells D8:D10 designate the left-hand side of the constraints.
-Refer to Figure 1.Which cell(s) are the Changing Cells as designated by "Solver"?
A) E4
B) B2:C2
C) B3:C3
D) D8:D10
E) B5:C5
Correct Answer:

Verified
Correct Answer:
Verified
Q23: Figure 1:<br> <img src="https://d2lvgg3v3hfg70.cloudfront.net/TB1469/.jpg" alt=" Figure
Q24: It is possible to solve graphically a
Q25: A warehouse stocks five different products,A,B,C,and
Q26: An ice cream shop sells single
Q27: If an isoprofit line can be moved
Q29: When using Solver,the parameter Changing Cells is
Q30: "Solver" typically generates which of the following
Q31: A company can decide how many additional
Q32: The constraint for a given resource is
Q33: A linear programming problem has the following