Not Answered
In an one-factor ANCOVA, suppose the factor has two levels (groups). Scatterplots of the dependent variable (Y) and the covariate (X) are generated (where group 1 is indicated by "•" and group 2 by "o"). Which of the following graphs shows the most desirable situation?
a.  b.
b. 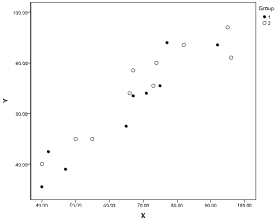 c.
c. 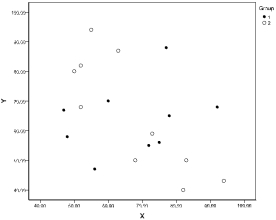 d.
d. 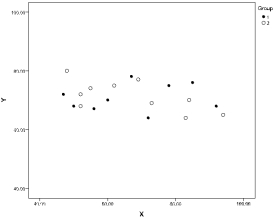
Correct Answer:

Verified
Correct Answer:
Verified
Q11: If both ANOVA and ANCOVA are conducted
Q12: Using the same data set, which part
Q13: In a randomized experiment (true experiment), if
Q14: In the study described in Question 14,
Q15: If the regression slopes of the dependent
Q17: In reviewing the assumptions, Susan runs an
Q18: based on the following scenario:<br>A researcher
Q19: Barbara wants to know whether students
Q20: An experiment was conducted to compare four
Q21: If the dependent variable, math score (Y),