Multiple Choice
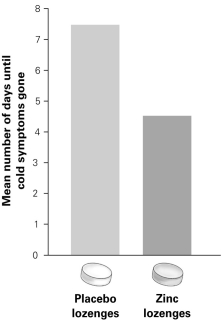
-According to the graph, how did the number of days with cold symptoms compare for people taking placebo and zinc lozenges?
A) People taking the placebo had cold symptoms for three more days than people taking the zinc lozenges.
B) People taking the placebo had cold symptoms for seven more days than people taking the zinc lozenges.
C) People taking the zinc lozenges had cold symptoms for three more days than people taking the placebo.
D) People taking the zinc lozenges had cold symptoms for seven more days than people taking the placebo.
Correct Answer:

Verified
Correct Answer:
Verified
Q54: What might be the next step if
Q55: Which of the following statements is a
Q56: What is a standard probability that is
Q57: Why are model organisms used to test
Q58: What would experimental results with very high
Q60: Ideally, what should an experiment studying the
Q61: Why is the scientific method used?<br>A) to
Q62: The average annual temperature among geographic regions
Q63: What would result from an ideal experiment?<br>A)
Q64: Why might scientists often be hesitant to