Multiple Choice
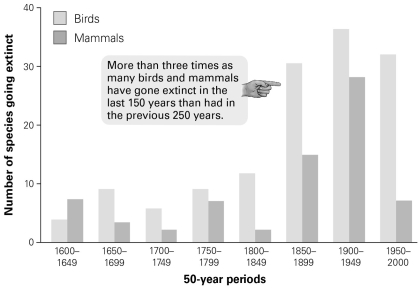
-According to this graph, when did the extinction rate in mammals exceed that of birds, if at all?
A) 1600-1649
B) 1700-1749
C) 1800-1849
D) 1900-1949
Correct Answer:

Verified
Correct Answer:
Verified
Related Questions
Q43: Most of the energy contained in one
Q44: Each breed of dog is known to
Q45: During the nineteenth century, sea otters were
Q46: North Atlantic right whales, Eubalaena glacialis, were
Q47: Cattle egrets hitch a ride on domestic
Q49: Teosinte is a wild grass in Mexico
Q50: What is the best strategy for preserving
Q51: To address the problem of preserving biodiversity,
Q52: What term includes the variety of species
Q53: Over the past 580 million years, how