Multiple Choice
The following question are based on the following graph:
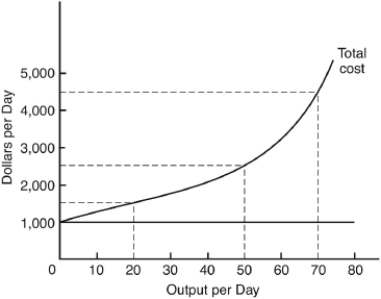
-At 50 units of output per day,total fixed cost is
A) $1,000.
B) $1,500.
C) $2,500.
D) $3,500.
E) $4,500.
Correct Answer:

Verified
Correct Answer:
Verified
Related Questions
Q8: In the previous question,if marginal cost for
Q9: The additional satisfaction received from consuming an
Q10: The law of diminishing marginal utility implies
Q11: The following question are based on the
Q12: To an individual firm,its costs represent<br>A) gross
Q14: The fact that a single large factory
Q15: The following schedule shows the utility Mr.
Q16: The experience of 1971 price ceilings on
Q17: The following question are based on the
Q18: A consumer's demand curve slopes downward because