Not Answered
In a study that investigated the relationship between television watching habits and work productivity, researchers asked respondents three items related to their TV watching:
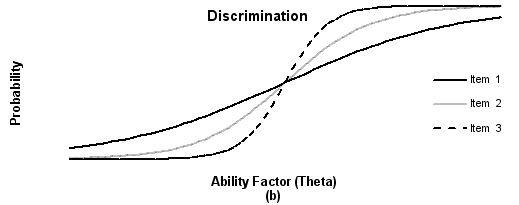
a. Item 1: On an average week, do you watch television?
b. Item 2: How often do you watch television with others (rather than by yourself)?
c. Item 3: How many hours per day do you watch television?
However, when the researchers ran their item response analyses, they realized they never learned how to interpret them - so they called you. Your task is to describe what is happening in the figure below. Specifically: (a) briefly describe what we are looking at - what do "discrimination" and "ability (or theta)" represent in the context of the study? (b) interpret the three curves for someone at theta = -2, and describe to the researchers what that means; (c) describe how we would determine whether a curve reflects "good" discrimination; and (d) based on that information, suggest to the researchers which item(s) they should keep and which item(s) they should remove, and be sure to explain why you are offering those suggestions.
Correct Answer:

Verified
Correct Answer:
Verified
Q1: Briefly define the following components of Campbell
Q2: Generating a large pool of items, consulting
Q4: Edward and Elvira developed a 50-item scale
Q5: In terms of reliability, describe how analyses
Q6: Imagine that Susan is a high school
Q7: William Smythe wanted to create a
Q8: Face validity differs from other forms of
Q9: In the MTMMM, monotrait-heteromethod triangles:<br>A) assess convergent
Q10: In an experiment on teen aggression and
Q11: _(a)_ is the degree of relationship between