Multiple Choice
Which of the following graphs reflect possible outcomes of a growth curve modeling design? (circle all that apply)
A) 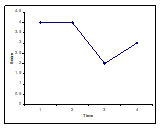
B) 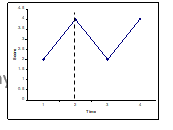
C) 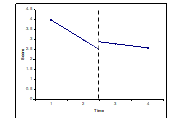
D) 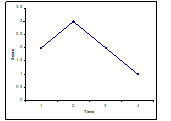
Correct Answer:

Verified
Correct Answer:
Verified
Related Questions
Q19: This form of psychophysiological measurement is concerned
Q20: Not all social programs are amenable to
Q21: The "Stroop" Task is an example of:<br>A)
Q22: What conditions must be met to be
Q23: Describe the basic and defining features of
Q25: Evaluators were interested in the long-term
Q26: With propensity scores analyses, the difference between
Q27: In terms of internal validity (i.e., least
Q28: This type of evaluation is used to
Q29: Which of the following techniques is an