Multiple Choice
Each of the panels given below represents the short-run equilibrium in the U.S. economy. The Aggregate Demand and Aggregate Supply curves in each panel responds to various economic changes.
Figure 8.1
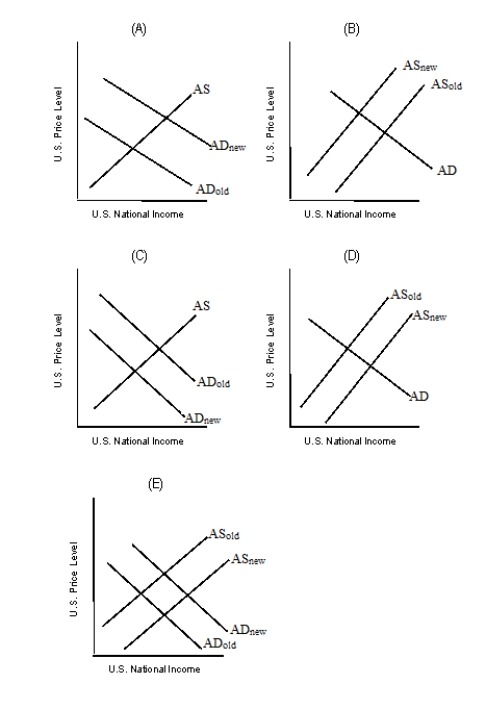
-Refer to Figure 8.1. Which of the graphs in the figure best describes the impact of a generalized more optimistic view of the future by consumers?
A) Panel A
B) Panel B
C) Panel C
D) Panel D
E) Panel E
Correct Answer:

Verified
Correct Answer:
Verified
Q1: In the long run, increased government spending
Q11: Assume that the AD curve is held
Q43: In the short run, a decrease in
Q59: The positive slope of the AS curve
Q69: Consider the following statement: "If the government
Q104: Other things equal, an increase in aggregate
Q107: The table given below reports the
Q108: Which of the following is true of
Q119: The movement of the vertical _ curve
Q121: Other things equal, an increase in aggregate