Multiple Choice
The figure given below represents the long-run equilibrium in the aggregate demand and aggregate supply model.?Figure 8.2
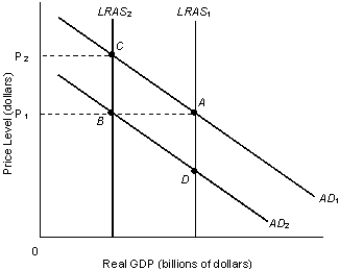
-Refer to Figure 8.2. The combination of rising prices and falling output is known as stagflation. This phenomenon is represented by which of the following shifts?
A) 
B) 
C) 
D) 
E) The combination of 
Correct Answer:

Verified
Correct Answer:
Verified
Q44: If the average price level falls, the
Q46: Other things remaining unchanged, the flatter the
Q57: The economic reasons that underlie the shape
Q79: An increase in aggregate demand normally does
Q80: In the 1970s the international price of
Q81: The table given below reports the
Q89: A decrease in the price level will
Q111: Each of the panels given below represents
Q117: Which of the following is most likely
Q121: Other things equal, an increase in aggregate