Multiple Choice
The figure given below represents the long-run equilibrium in the aggregate demand and aggregate supply model.?Figure 8.2
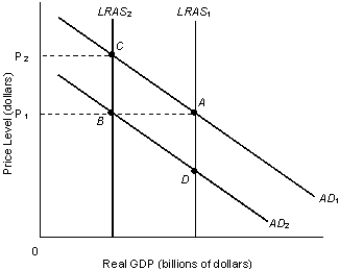
-Refer to Figure 8.2. Suppose major oil-exporting countries restrict oil output, thus increasing the price of oil. In the figure this would be represented by:
A) a movement from A to C.
B) a movement from A to B to C.
C) a movement from B to C.
D) a movement from B to A.
E) a movement from C to A.
Correct Answer:

Verified
Correct Answer:
Verified
Q28: Which of the following is an impact
Q34: Government spending is set by the federal
Q36: The change in aggregate expenditures resulting from
Q47: The _ is the change in the
Q61: The figure given below represents the equilibrium
Q62: When the actual inflation rate rises more
Q69: In the short-run, an increase in the
Q83: Which of the following is most likely
Q102: Assume that the aggregate demand increases while
Q112: Identify the correct statement.<br>A)Aggregate demand alone determines