Multiple Choice
The figure given below represents the equilibrium real GDP and price level in the aggregate demand and aggregate supply model.?Figure 8.3
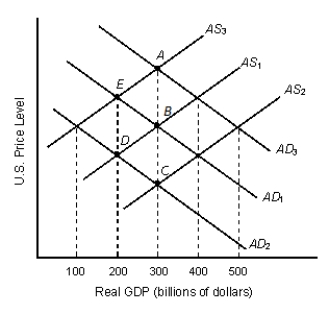
-In Figure 8.3, which of the following shifts would result in stagflation (economic stagnation and inflation) ?
A) AS₁ to AS₂
B) AD₁ to AD₂
C) AD₂ to AD₁
D) AD₂ toAD₃
E) AS₁ to AS₃
Correct Answer:

Verified
Correct Answer:
Verified
Q6: Other things equal, an increase in aggregate
Q29: Given that energy is an input in
Q31: Suppose an increase in investment spending results
Q32: In the long-run, the aggregate supply curve
Q54: The aggregate supply curve shows the negative
Q64: The purchase of fifty new food-processing machines
Q65: The slope of the aggregate supply curve
Q70: If the exchange rate is defined as
Q80: Which of the following is true of
Q98: An increase in the real value of