Multiple Choice
The figure given below represents the saving function of an economy.
Figure 9.1
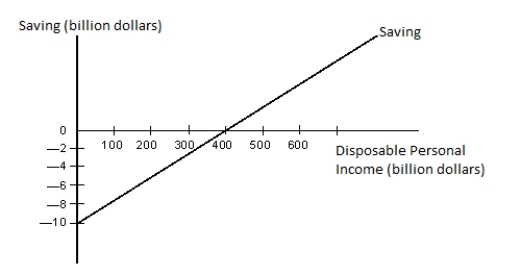
-Refer to Figure 9.1. An increase in autonomous consumption would be illustrated by:
A) an upward shift of the saving function.
B) a downward shift of the saving function.
C) a downward shift of the corresponding consumption function.
D) a movement to the right along the saving function.
E) a movement to the left along the saving function.
Correct Answer:

Verified
Correct Answer:
Verified
Q5: Which of the following will cause the
Q11: Which of the following is least likely
Q31: Keynesian economics developed in response to:<br>A)the Great
Q35: The consumer confidence index can be defined
Q40: Which of the following variables do not
Q76: _ is the primary determinant of consumption
Q106: When disposable income is zero, consumption is
Q108: The figure given below represents the consumption
Q109: At the point where consumption equals disposable
Q114: The sum of money spent by a